

Your workout app gives you numbers, sets, reps, weight, maybe a basic line chart. LiftShift turns those same numbers into answers you can actually act on. Here's how each feature works.
1. Muscle heatmaps: see your training balance
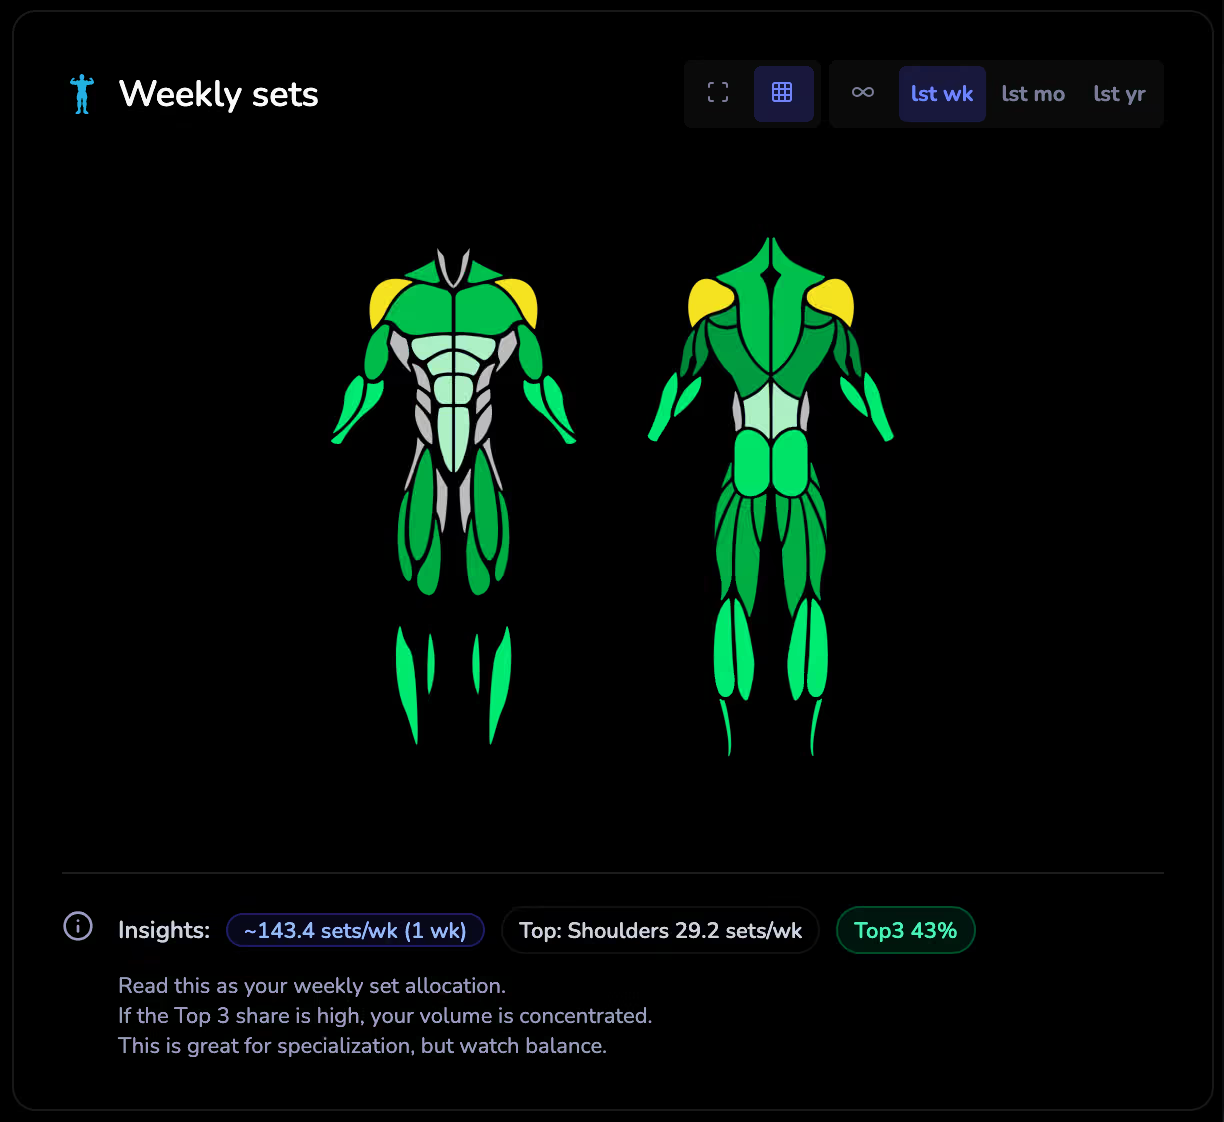
The body map shows a heatmap of your weekly volume per muscle group. The key difference from basic app heatmaps: these are rolling 7-day windows, which matches how your body actually recovers, not arbitrary calendar weeks.
Hover any muscle to see your weekly set rate, current volume zone (maintenance, growth, or overreaching), and estimated progress %. Click a muscle to drill into exactly which exercises contribute, with primary and secondary involvement weighted separately.
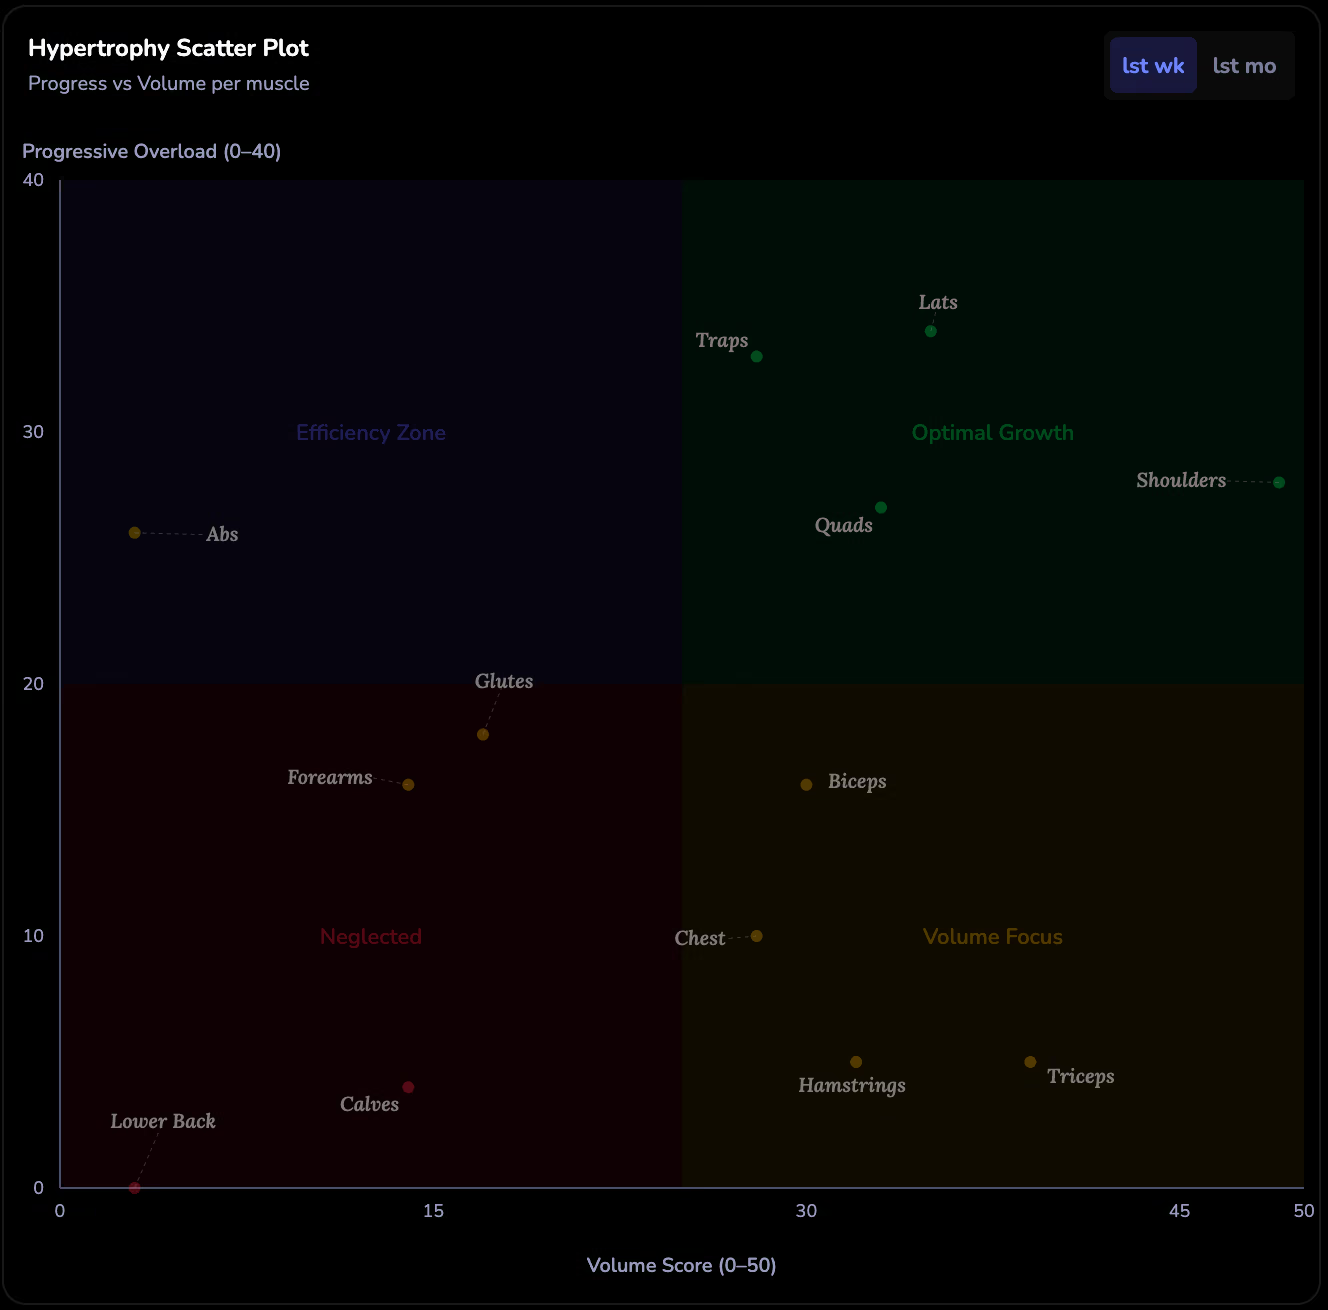
A “top 3 concentration” metric warns you if too much volume is concentrated in a few muscles. Green = well-distributed. Red = you might be neglecting something.
2. Exercise status: know if you’re improving
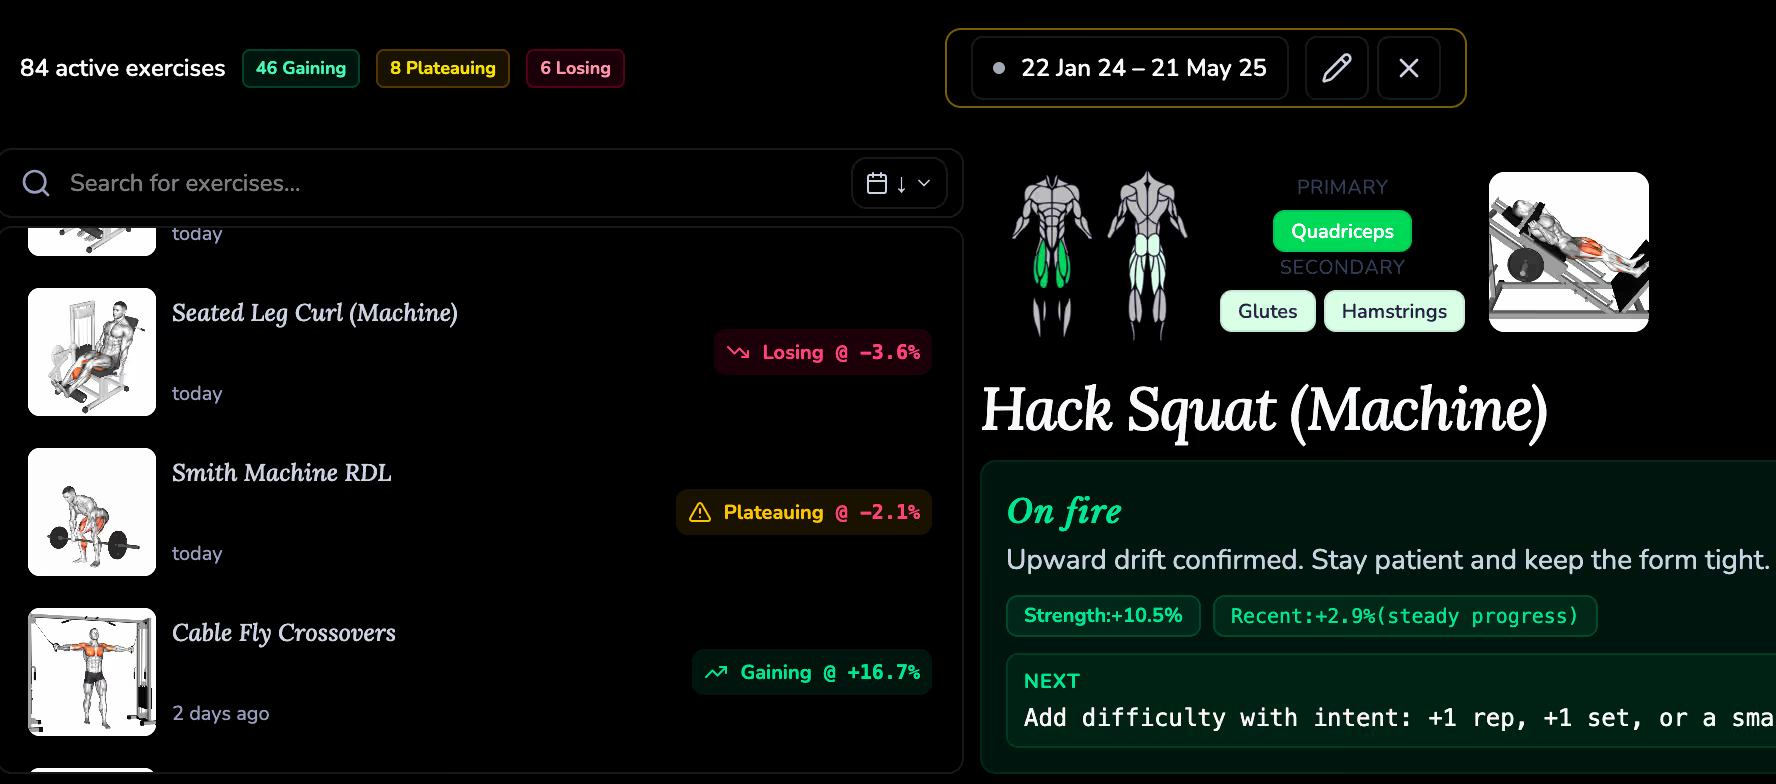
Every exercise you’ve logged gets analyzed and labeled:
- Getting stronger: Clear positive trend (> +1% strength change).
- Plateauing: Roughly stable (between -3% and +1%).
- Taking a dip: Clear drop (> -3%).
- New: Not enough sessions yet to read a trend.
Each status comes with a confidence level (based on how many sessions you’ve logged) and a suggestion card with concrete next-session advice.
3. Set-by-set feedback: learn from every lift
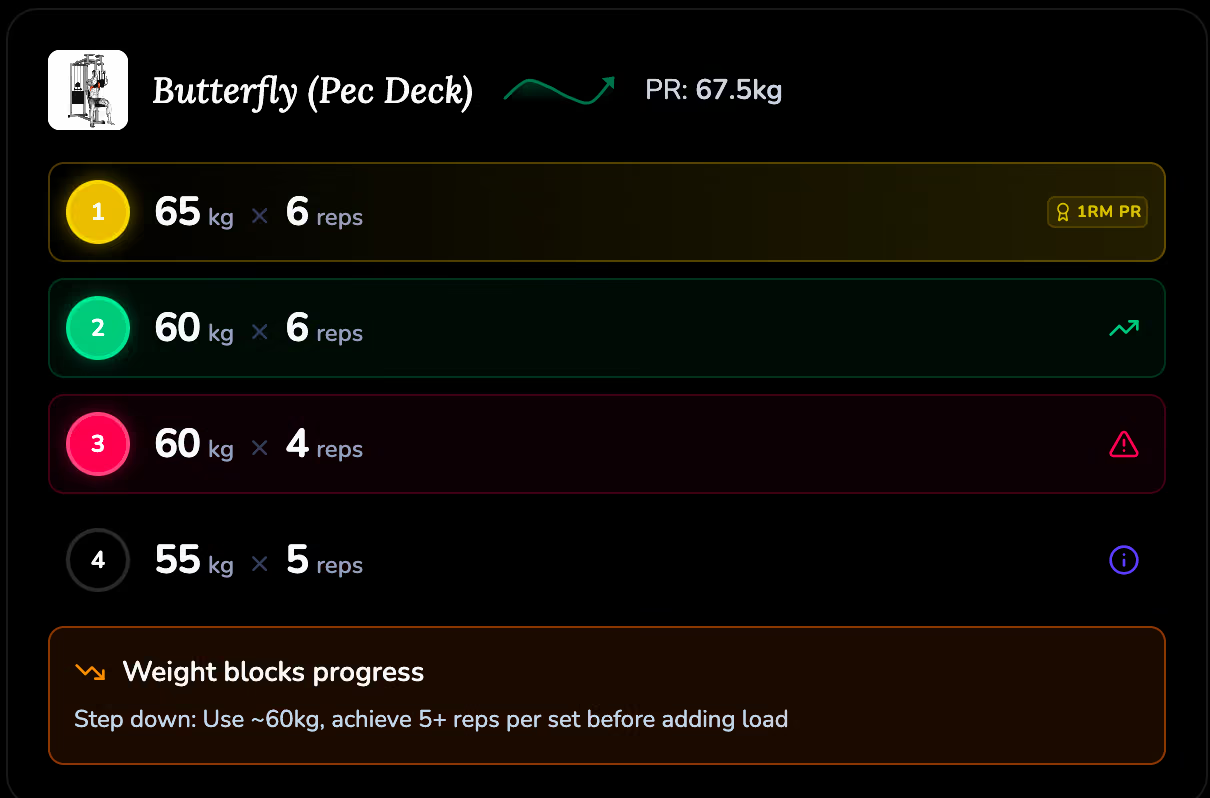
This is the feature beginners find most useful. Open any past workout and LiftShift analyzes each set relative to the previous one across 19 scenarios:
- Same weight, reps increased: “Found More” or “Building Momentum”
- Same weight, mild drop: “Normal Fatigue”
- Weight increase, reps below target: “Too Aggressive” or “Not Ready”
- Weight decrease, reps met: “Good Reset” or “Fatigue Managed”
Each badge has a tooltip with exact numbers. An “improvement” line tells you what to do next session. A “why” line explains what just happened.
4. Smart PR tracking: more than all-time bests
LiftShift tracks seven kinds of PRs per exercise:
- Gold PRs: True all-time bests for weight, 1RM estimate, set volume, session volume, reps, weighted reps, and distance.
- Silver PRs: Best in the last 1 month. Important for experienced lifters who rarely hit true all-time PRs.
- Premature PRs: A big spike that wasn’t sustained in follow-up sessions. Flagged so you know it wasn’t a real breakthrough yet.
It also tracks PR droughts (days since last all-time PR) and PR frequency (new PRs per week). The dashboard summary tells you if your momentum is heating up or cooling off.
5. AI-ready export: ask your own questions
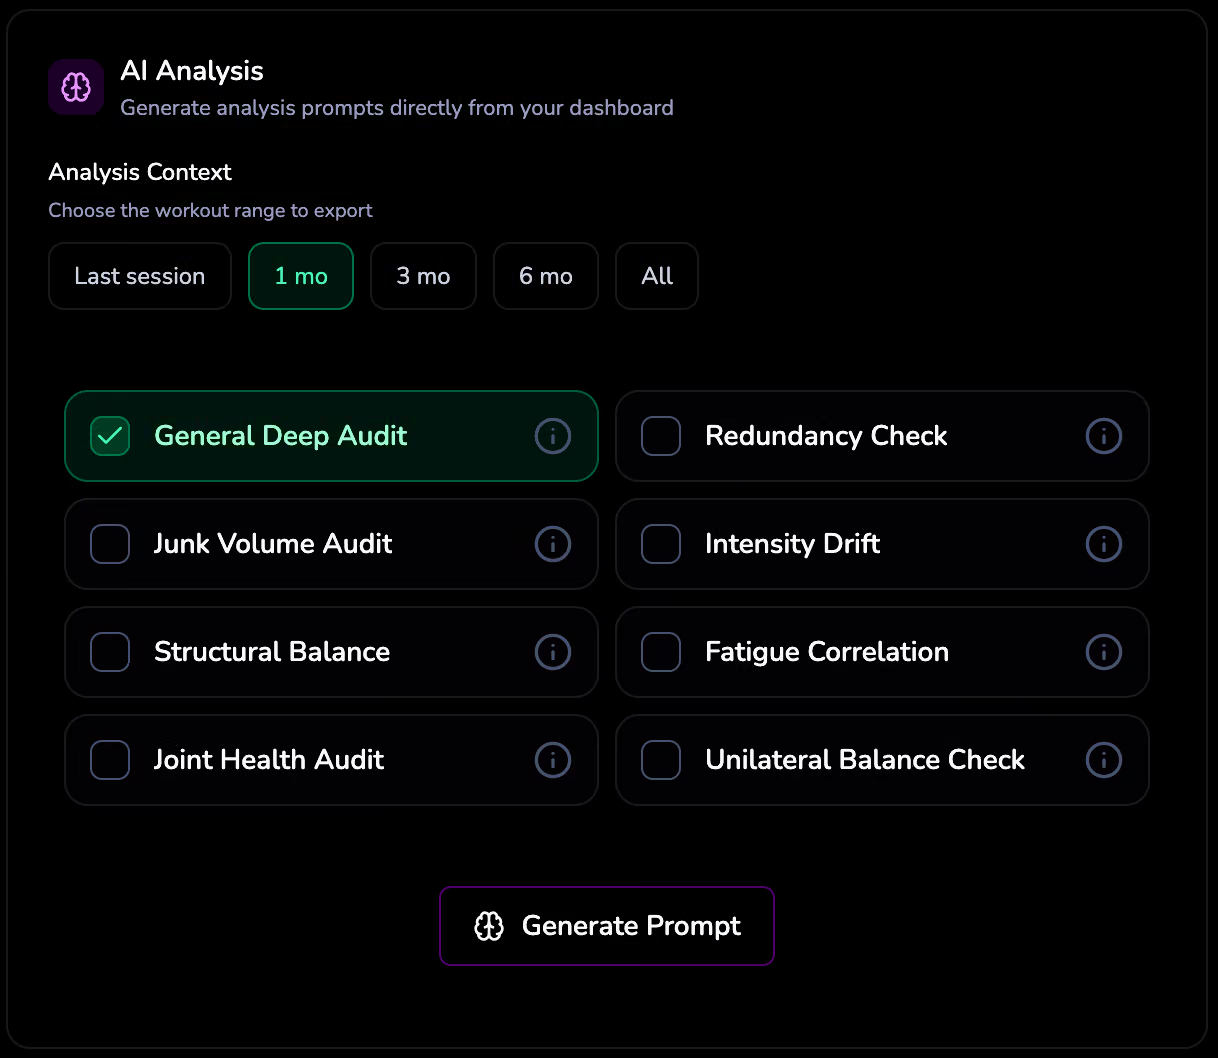
LiftShift can export your full training history in a structured format designed for AI analysis. You pick a timeframe (last session, 1/3/6 months, or all data), optionally select analysis modules (junk volume audit, structural balance, joint health check, intensity drift, etc.), and it generates a prompt + clipboard-ready data. Paste into any AI and ask anything.
The built-in modules cover: comprehensive audit, redundancy check, junk volume audit, intensity drift, structural balance, fatigue correlation, joint health, and unilateral balance. Or write your own custom prompt.
6. Calendar filtering: zoom into any block
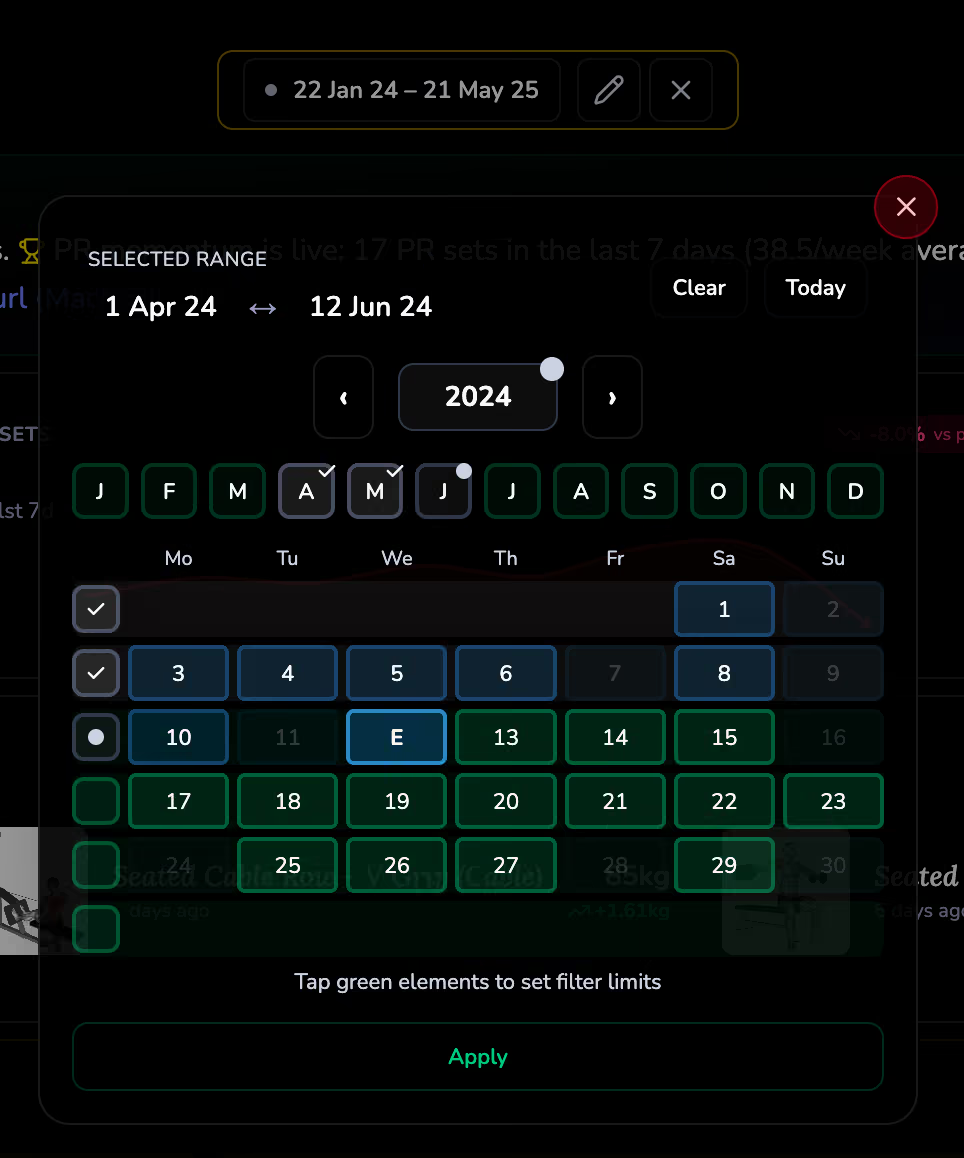
This is simple but powerful. Pick any date range, a single day, a week, a month, a year, or multiple custom ranges, and every chart, every metric, every insight recalculates for just that window. Compare your 2025 training against 2024 in seconds. Isolate a specific training block and see what changed.
7. Consistency heatmap & Flex cards
A GitHub-style heatmap shows your entire year’s training at a glance, workout days as colored squares, intensity by volume. You also get a consistency score, weekly streak counter, and average workouts per week.
Flex cards are shareable year-in-review summaries: total volume lifted (with fun real-world comparisons), best month, longest streak, top exercises, muscle balance, and total PRs. Designed to look good when shared.
8. Lifetime Progress
Every muscle gets a 9-tier journey from Seedling to Legend based on your cumulative lifetime sets. Uses a diminishing-returns formula so early milestones feel achievable and late tiers require real dedication. Shows estimated time to your next milestone if you keep training at your current weekly rate.
Try it free
Every feature above is completely free. No account required. All analysis runs in your browser.
Open LiftShift →